September 1, 2025
Digital Marketing
6
minutes reading
Create a Custom Automated Report Using Minimal Resources
The traditional way of reporting on marketing performance has its limits. While using GA4 and Looker Studio, you skip over social media and other channels. Your stakeholders would appreciate getting all the information in one place. It’s just not practical or appealing. On top of that, creating automated reporting is time-consuming, and it’s rarely a priority in small company environments. But what if there were a way to do it? Consolidated, and for just a buck. Let’s set up custom reporting using Framer and Cloudflare.

During my career, I worked for multiple mid-size companies. In every single one of them, reporting and data were a low priority for marketing, especially the periodic and frequent performance reporting. 😦?? I know. I didn’t think much of it then but recently I felt there had to be a way to make our data accessible with all the new tools lying around—even in a company with limited resources.
Stack and Cost
Firstly, let’s outline the conditions that we want to meet with our automated reporting. The aim of the report is to consolidate data from all channels and make them accessible via one link, all that for as cheap as possible and with as little maintenance as possible.
Here is a list of our conditions:
Data are consolidated from all channels
Report is accessible with a single link
Report is as low cost as possible
Report has low maintenance
Next, let’s take a look at the tech stack that we utilize to make it happen:
Google Sheets - are all we need. Furthermore, Sheets come with many useful extensions, among which there are API connectors to social media and GA4.
Google API - in order to connect sheets to Cloudflare we need an API key, we can get one at Google Developers Console.
Framer - our front-end, bring a ton of options for customization. The joker card of Framer is that it allows us to fetch data from custom API end-point.
Graphy - we need nice charts, don't we. Luckily there are Graphy charts. Huge benefit is that they works with Google Sheets right out of the box. (They are also fully integrated to Framer now, they weren't at the time of creating the report)
Cloudflare - our back-end solutions. Cloudflare worker will serve as a bridge between Framer and Sheets DB.
Cost breakdown:
Sheets - $0 (worth mentioning that the API connector extension is also $0)
Google API - $0, to quote Google: "All use of the Google Sheets API is available at no additional cost."
Framer - $0 in the free tier which is all we need
Graphy - $0 in the free tier, $16 / month if we want to have custom color meaning nicer reports (totally optional)
Cloudflare - $0 in the free tier which is all we need
Yes that's all we need. And also, if we want to vibe code it, then we need an AI subscription. But, hey, also optional.
Now, let’s make it, shall we?
Design
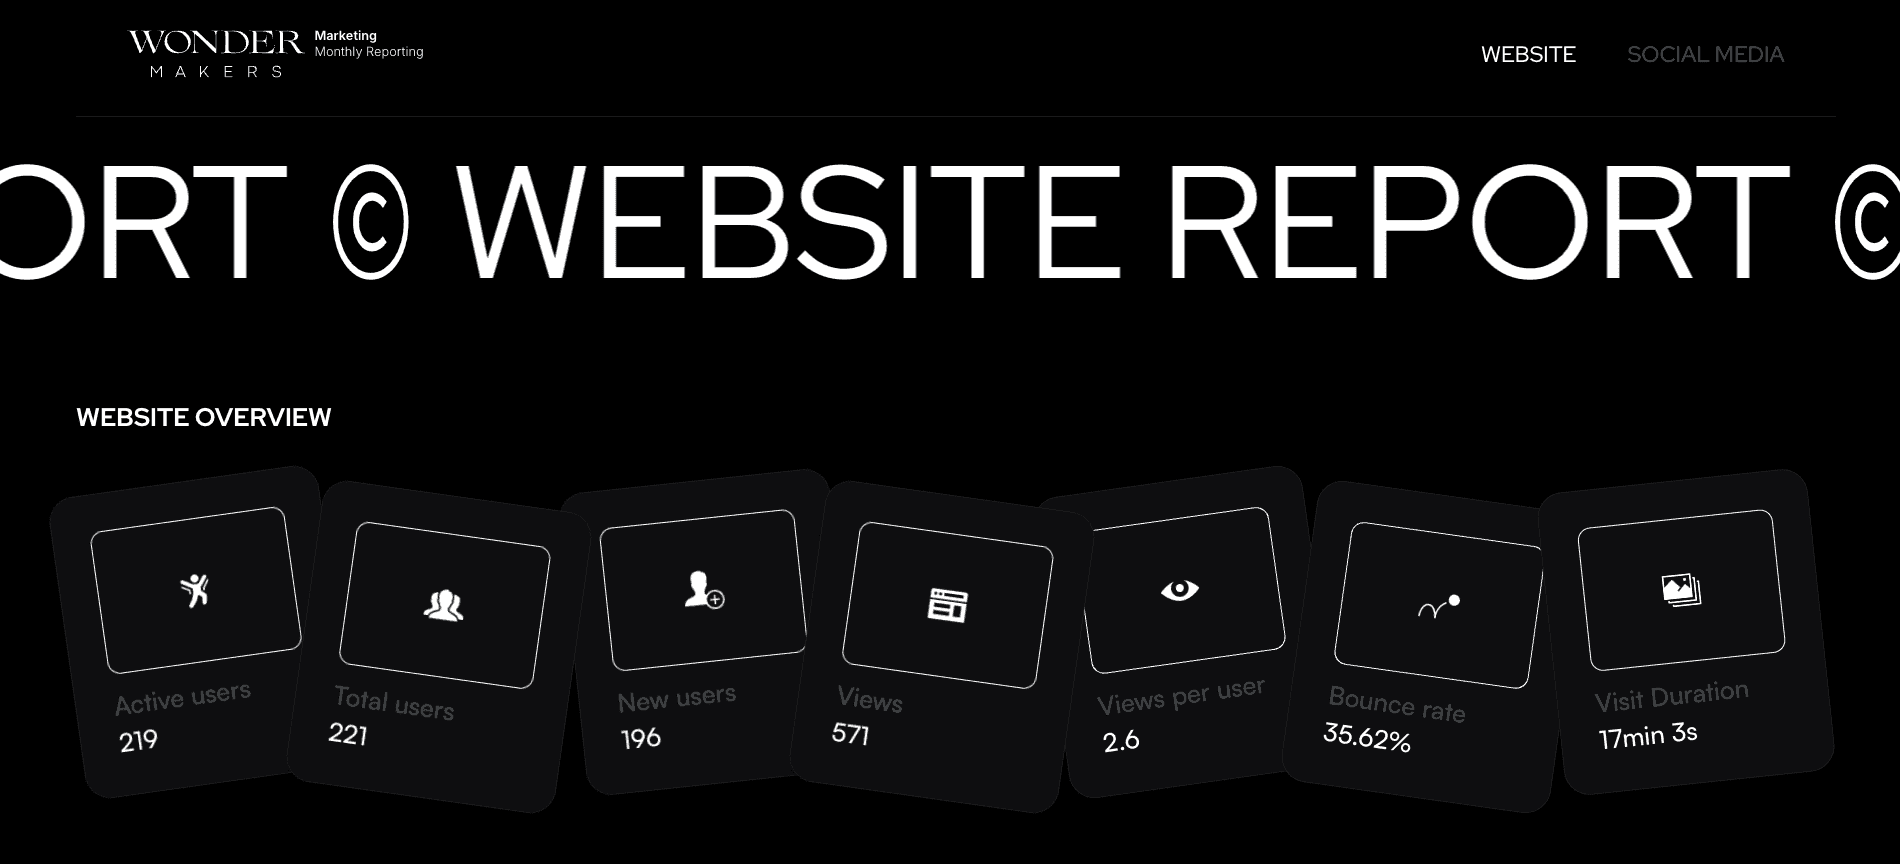
The report has a very simple design with just a few sections to illustrate that it could work. It has two main pages: the website performance and the social media report. Both pages start with a card section where each card represents a different metric. There is a hover effect on each card, a small design detail meant to draw attention to the metric at hand when reporting on it. Finally, all cards show month-to-month changes.
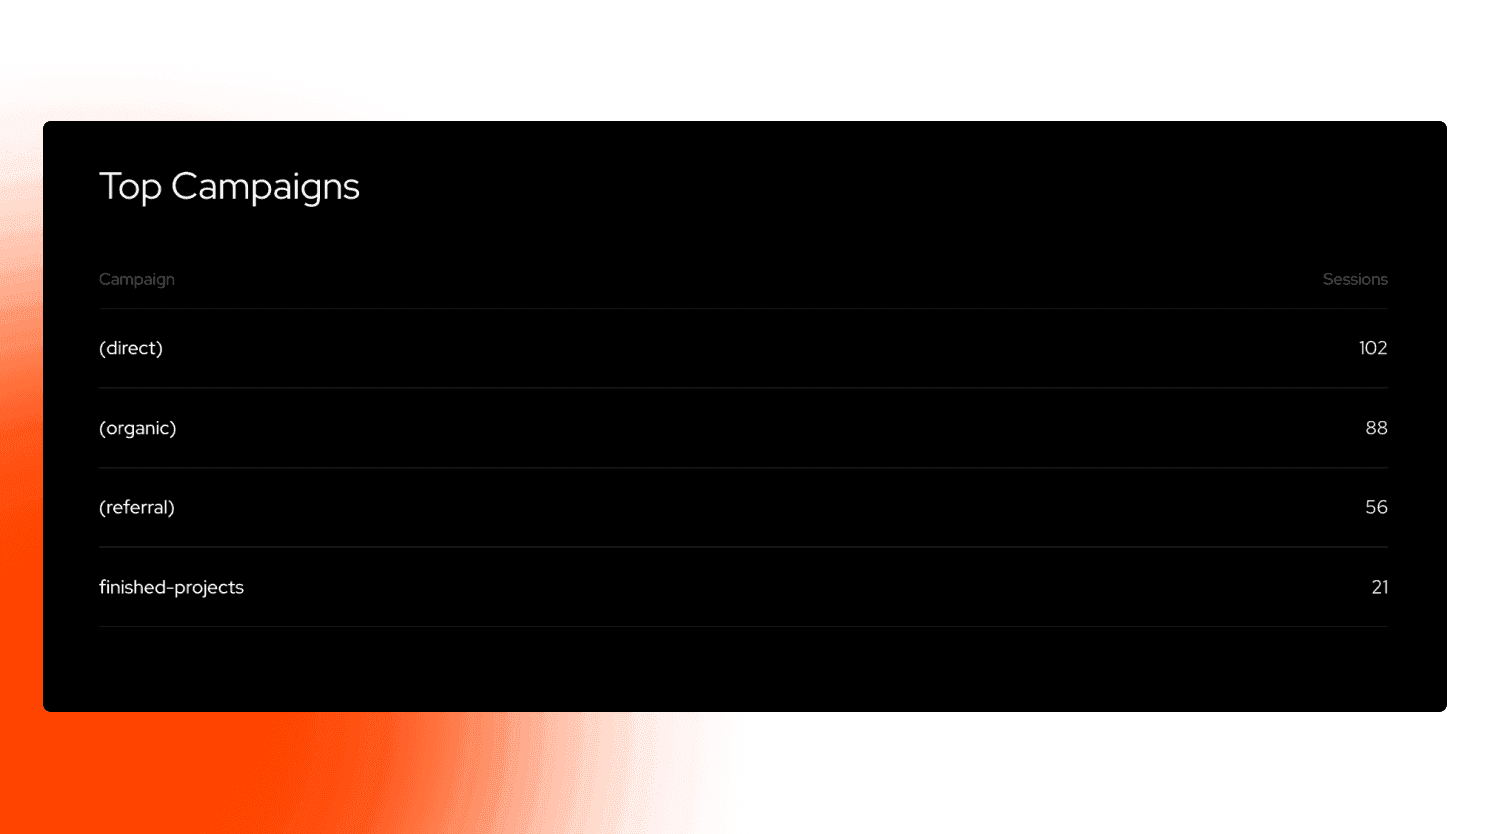
The website report has a slider in the lower section with tables that provide more specific information, including top pages, sources, mediums, and campaigns—everything one might need from such a report.
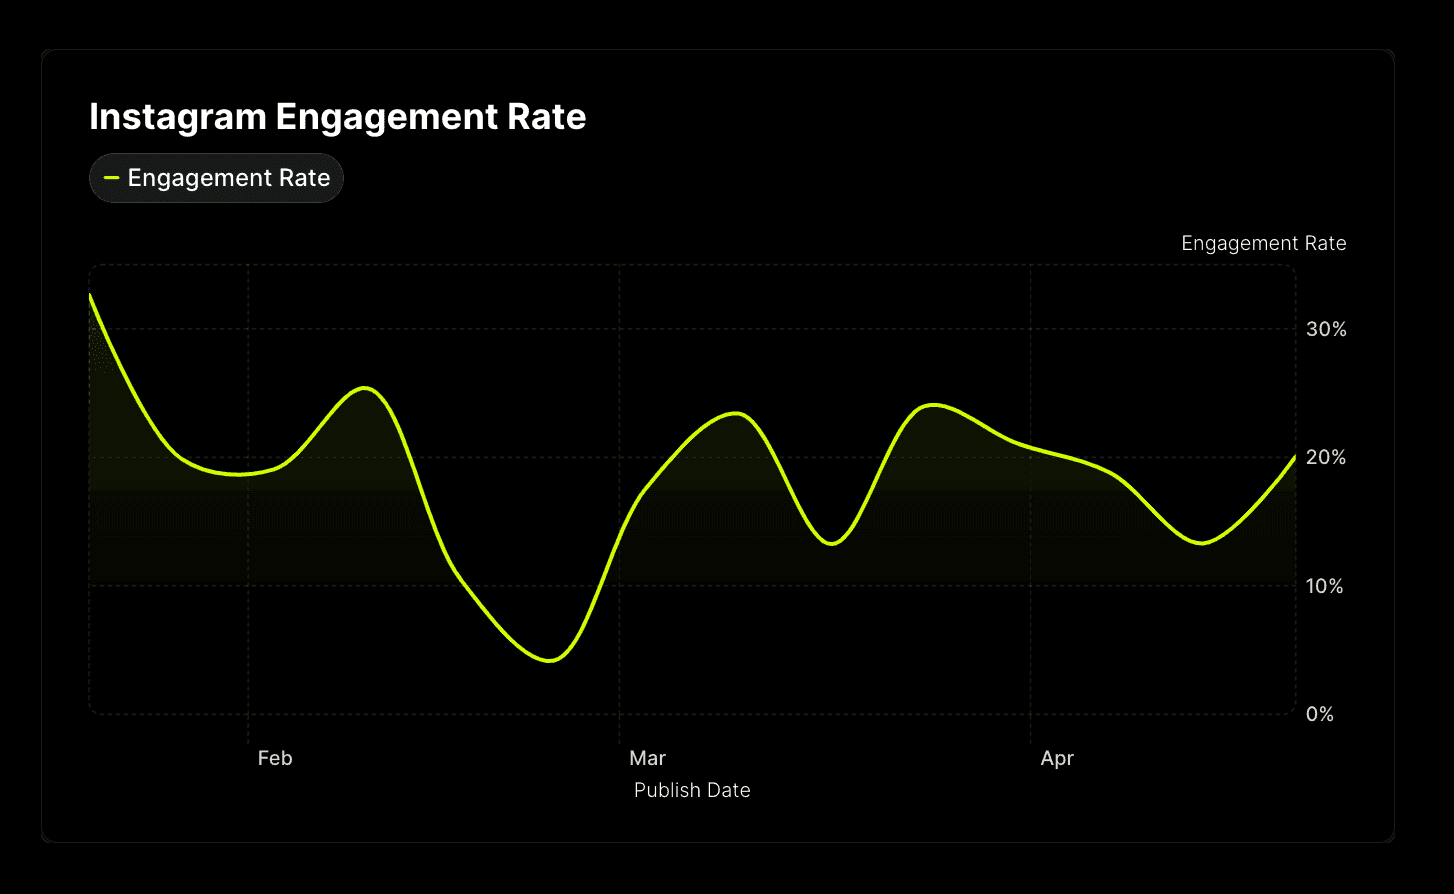
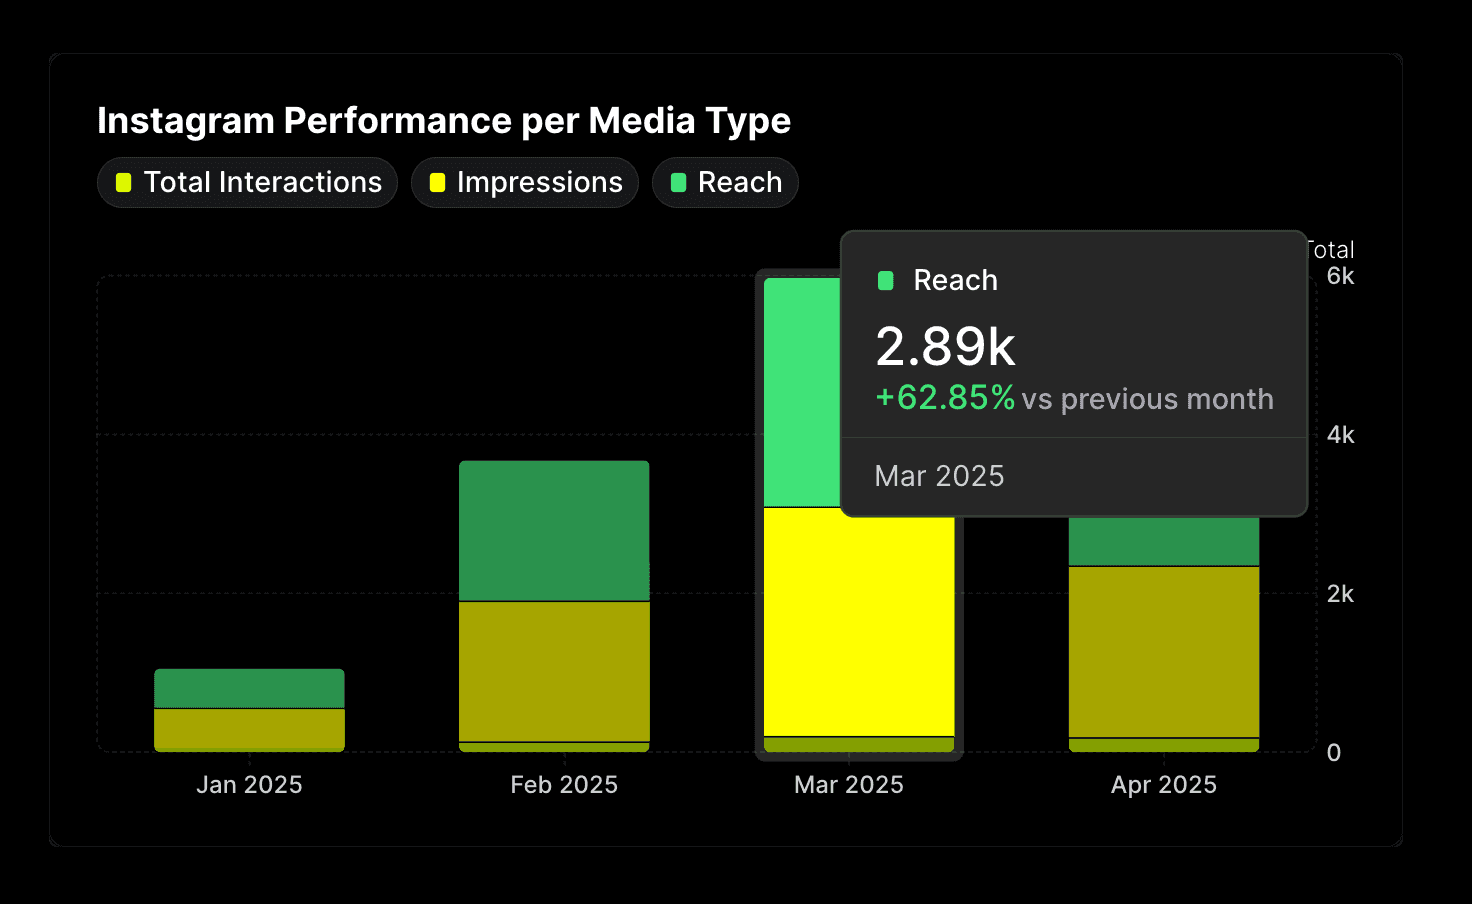
The social media report offers more visually presented data. It uses Graphy charts to show three key metrics from Instagram: engagement rate, post impressions, and performance per post type.
Of course, there could be more pages, more metrics, more tables, more… But here, there is only the essential. Feel free to scale up if you need to.
Structure
Google Sheets
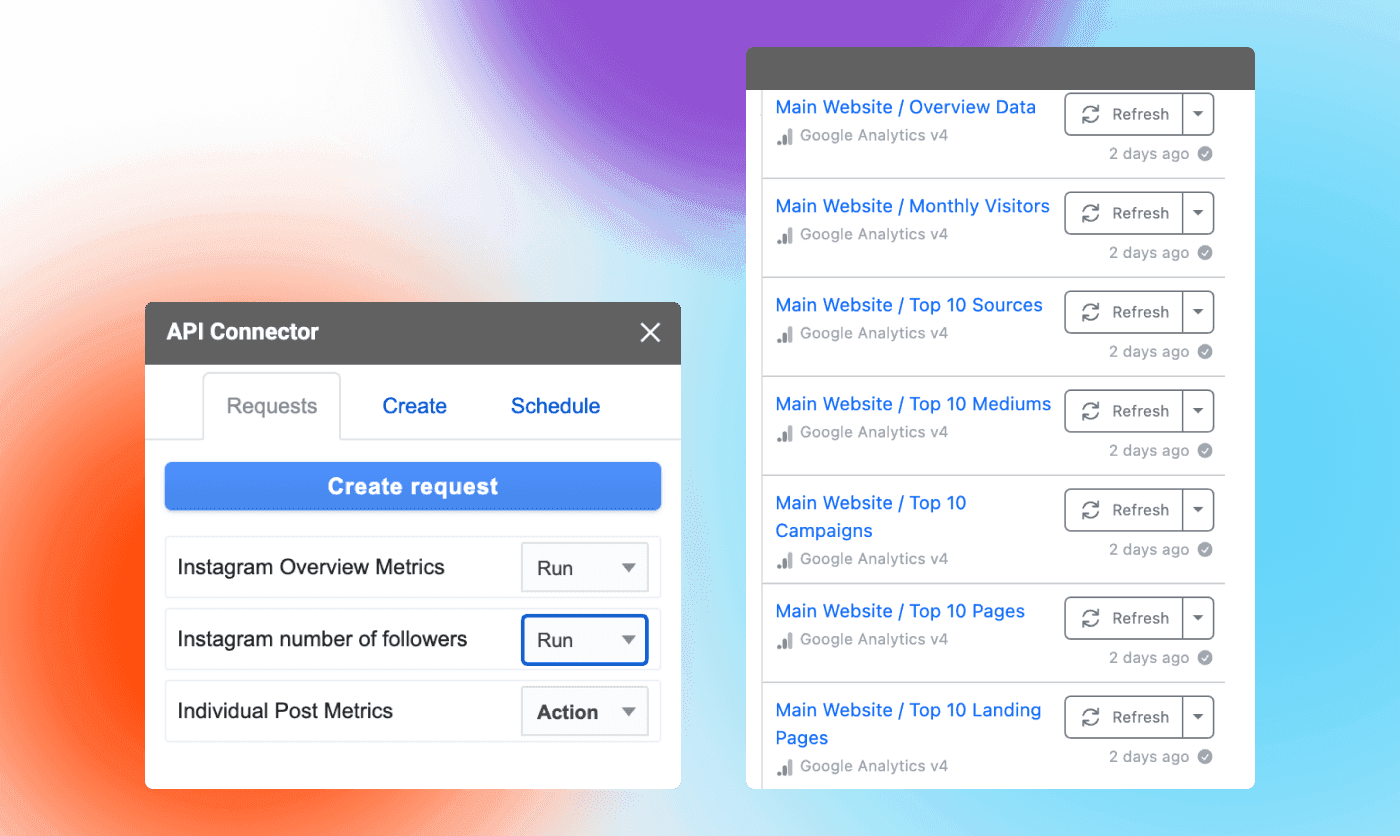
We can start with Sheets. Every sheet in the report will represent one set of data. Why? We will explain that in detail later, but briefly, to categorize our data. For example, our top pages data will populate a single list in the file, top campaigns another list, and so on. We can populate all lists automatically by using the Google Analytics data via the SyncWith extension. Which data you want to have in the report, in which order, is up to you. Don't be shy, go crazy.
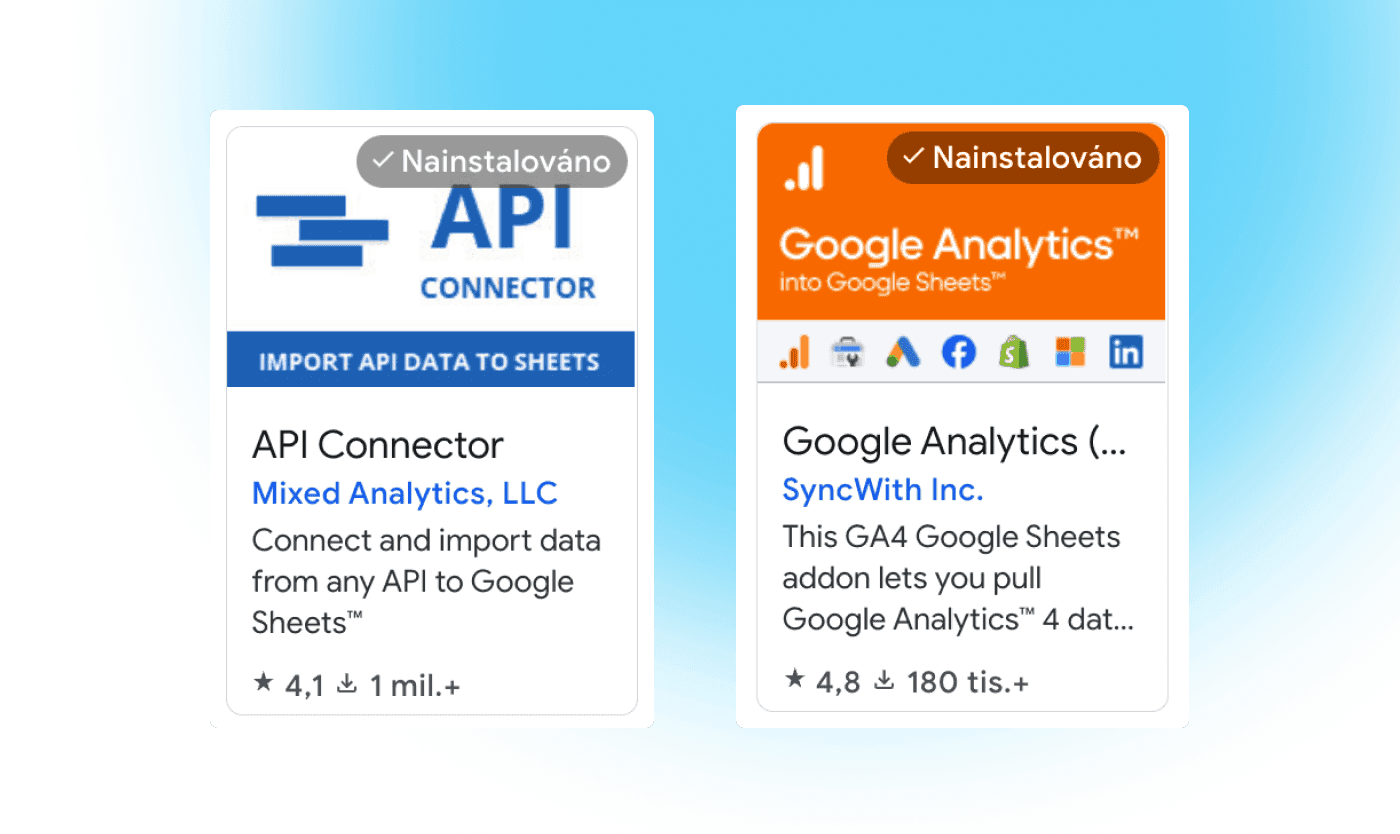
We can do the same for our social media, but this time we will use the API Connector extension. Alternatively, you can also use Supermetrics, or any other connector you like. I don’t want to go into too much detail about the configuration process because I tend to overcomplicate things, but I believe you will be able to set it all up. If not, no worries, hit me up and I can try to help you.
Cloudflare
Before we begin, we should establish the Google API. We can do so by creating an account in the Google Developers Console. After creating a new project, we proceed by enabling the Sheets API and creating new credentials for our project. The newly acquired API key will be placed at the top of our code. Similarly, we will take the ID of our Sheet and put it in a separate variable as well.
Now, below is the code for Cloudflare. Basically, it fetches data from our Sheets and processes it. I won’t pretend that I wrote every part of it since I mostly vibe-coded it using AI. But I think that makes this piece of content even more illustrative for its purpose. I can imagine that’s what you might like from your marketers too: to utilize the most of today’s tools.
Instead of going into too much detail, I will try to simplify what is happening in our code. There are instructive comments in the code that can help you navigate it and understand what is going on in each part.
First, we compose a fetch request to Sheets to get our data and store it so we can use it. We create a helper function that loops over a selected part of the data and slightly transforms it so it is easier to work with in Framer. Next, we split our data into categories. Remember, we already structured our Sheets, one category per list. Now we follow this structure and use our helper function on each part of it. If the fetch request is successful, meaning the data exists, we create an object named after the path in fetch request e.g. source, campaign, medium, and so on, then, we include the corresponding data in it. Finally, we serve the data as a response that can be read by Framer.
TL:DR
A Cloudflare worker creates an endpoint that can be called. By calling a specific path in this endpoint, we navigate to a specific piece of data, transform it, and deliver it to whoever is asking for it in a readable form, in this case Framer.
Framer
Now that we have our data ready, we can use it. In Framer, thanks to the developers, we can call for it using a fetch request. Getting to our data should be easy since we used our helper function to make the data readable. Here is also the JSON object itself how it comes out of a successful fetch request.
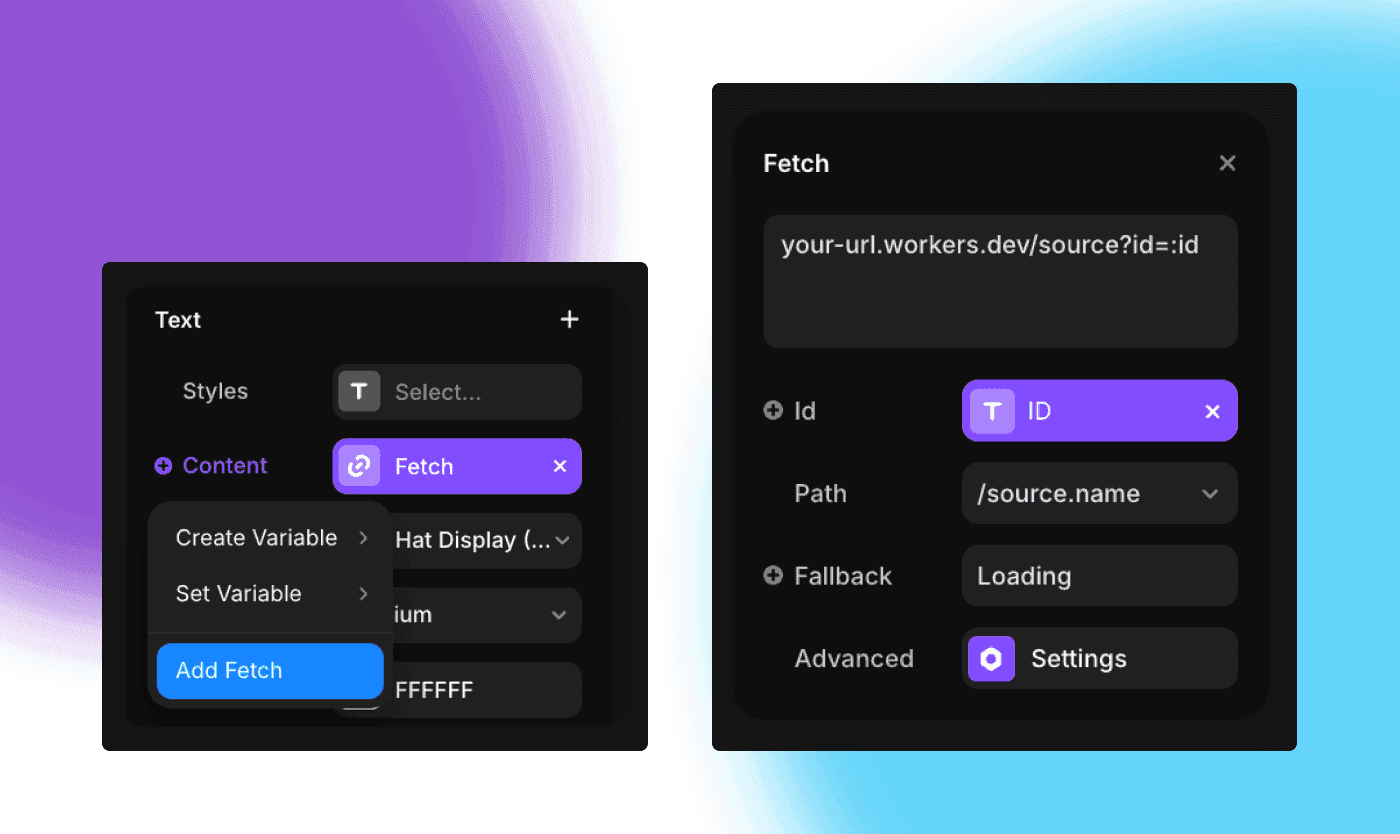
Let’s take a look at an example of populating the first line of our top sources table. We call a specific endpoint, in this case the source by composing an URL request . We also include a query parameter that will be populated from a variable in the Framer component. Lastly, we specify the path to the data. So we have the name under /source.name and data under /source.data respectively. We would continue like this for every cell we have in the table, but since we are using the variable we can only reuse the component and set the IDs for each cell.
Just to remind ourselves. Here is what we get after retrieving our data from the request.
I can imagine that’s what you might like from your marketers too: to utilize the most of today’s tools.
Summary
Well, we are coming to the conclusion. I would like to quickly go over what we accomplished with our creation. With Framer's public deployment the report is shareable with whomever we like. One link, and it’s good to go.
Maybe the most important feature of our report is that it consolidates data from all channels. Ours takes only website and social media data, but I am sure you can find other ways to get your data into the report.
The report is low cost. All providers have free tiers that get you started right away. The first upgrade I went for is surprisingly irrational: I upgraded Graphy just to get the colors unified with the brand. Other than that, the full deployment and maintenance costs are $0, not including the work (sorry, you gotta do the work 🤗).
Finally, the report is low-maintenance. The report shown in this post is about two or three months old. I haven’t made any changes to it since, kinda forgot about it to be honest :(, only to pleasantly find out that it is still running!
Disclaimer
Please take this post as just a hint on how you can automate your marketing reports. It might not work for your particular purposes. The majority of the coding work was done with the help of AI, which I think is great—we really do code in our native language nowadays. I hope you found some inspiration here, if yes, let me know!